Simple, Precise and Unique system - which is far ahead of Conventional Technical Analysis
Wednesday, May 3, 2017
Sunday, April 2, 2017
Gann Angle Charts
As posted in the chart most of the days NF spent time in the range between 9031-9157 and finally closed above 9157 on 31.3.2017.
Wednesday, March 22, 2017
NF 22.3.17
NF support at 9030 levels, from last 2 to 3 days many stocks showing their highs as vibration number not able to cross that high vibration number and yesterday some stocks holding just above their vibration lows. Expecting some down move in NF.
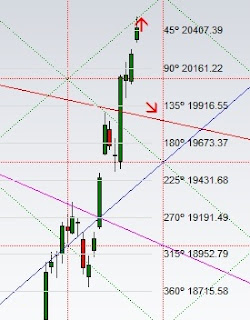
BNF just holding down sloping line and today it may slip below the line and it test 20650-20444 levels as per chart.
Monday, March 13, 2017
NIFTY FUTURES.....
14.3.17 A good day to watch NIFTY to tag the upper lines.
How the candle looks like on the chart 14th evening... :)
Sunday, February 12, 2017
Gann Angle Charts,
SUNPHARMA :
After prolonged downtred about seven* months SUNPHARMA futures closed above the price/time** angle on the 3*rd attempt. Watch for stock to upside...watch given support/resistance levels. Sunpharma showing positive bias as per GANN VIBRATION SYSTEM.
* Gann has given more importance to 3 and 7 numbers and the same explained in his books.
** Price/time angle : These are not default Gann Angles. Some customized calculations/cycles involved in this calculation.
If you ask any body to how you calculate these angles... ?
I will tell you how they give answer to the above Question...
Answer : You take default calculation.....based on this answer you never get these type of smoothed price/time angles with default settings. :)
Monday, February 6, 2017
Sunday, February 5, 2017
As per my previous post Century Textiles, Tata Steel going well. Read the post HERE
Currect price 914
Initial support given @ 774
TATASTEEL future :
Current Price : 473
Initial support given @ 451
Current Price : 473
Initial support given @ 451
Tuesday, January 24, 2017
Gann Angle Charts
As posted on January 18th post click here NF perfectly tagged the rising angle and zoomed almost 150 points as explained in the chart. NF has crossed ..............time period analysis, this market was poised for up.
As per time analysis also click here 23rd January market turned and honored NIFTY MASTER TIME FACTOR as per Gann Time Analysis workings. Now here onwards Jan. 23rd Low very important.
As per GANN VIBRATION SYSTEM Century Textiles, Tata Steel futures going well.
Monday, January 23, 2017
Wednesday, January 18, 2017
Gann Angle Charts
As posted in previous chart Bajaj Finance gann angle reached.
BNF face some pressure from falling Gann Angle. Watch corresponding support/resistance levels on the chart.
NIFTY - As per Time watch 23rd/24th January.
As per GANN vibration system some commodities rallying from last few days where as some stocks are showing high as it's vibration numbers.....
Tuesday, January 10, 2017
Sunday, January 8, 2017
Gann Angle Charts
NF closed above the falling gann custom geometric angle after four months, that too 7th attempt NF made it successfully. '7' is the most important in Gann Analysis. Rising angle acts as good support for 5th Jan candle.
But, Jan 9th is the time date as per 'previous' low (I'm not disclosing which low, if you are really interested in Gann analysis it's upto you to find or do 'read only mode'), not an major (major reaction
But, Jan 9th is the time date as per 'previous' low (I'm not disclosing which low, if you are really interested in Gann analysis it's upto you to find or do 'read only mode'), not an major (major reaction
Thursday, January 5, 2017
Banknifty Chart
Until BNF not closed above the 1 x 1 time price angle possible down side target as of now at
17690/17534
17690/17534
Sunday, January 1, 2017
NF Long Term Chart using Gann Angles :
Originally the below chart posted (in one of my friends group, at that time my blog is not in existence) in the Month of Dec. 2015 when the NF trading around 7800 area. Rest....you explore using below charts, as all the charts are self explanatory.
updated chart as of 30/12/2016
Reliance Futures Long Term Chart using Gann Angles :
Breaking the visible swing high, it is good to watch rising gann angle as per the chart, if failed watch alternatively lower rising Gann angle.
Subscribe to:
Posts (Atom)


